How to understand artificial intelligence - Machine learning?
At SINNETIC, our cognitive services unit develops analytical and artificial intelligence models to...


The pharmaceutical sector has commercial and "go to market" challenges to overcome. Some use cases from data science that respond to these challenges are: Prescriber analytics, People Analytics, Pricing, Demand-Driven Planning & Optimization, MarkDown, Use of external data.
A use case is a design plan focused on the information user. It maps the path that data follows from the time it is collected until it becomes a high-value asset for the business. The chart below shows the main use cases in the commercial setting of the pharmaceutical industry:
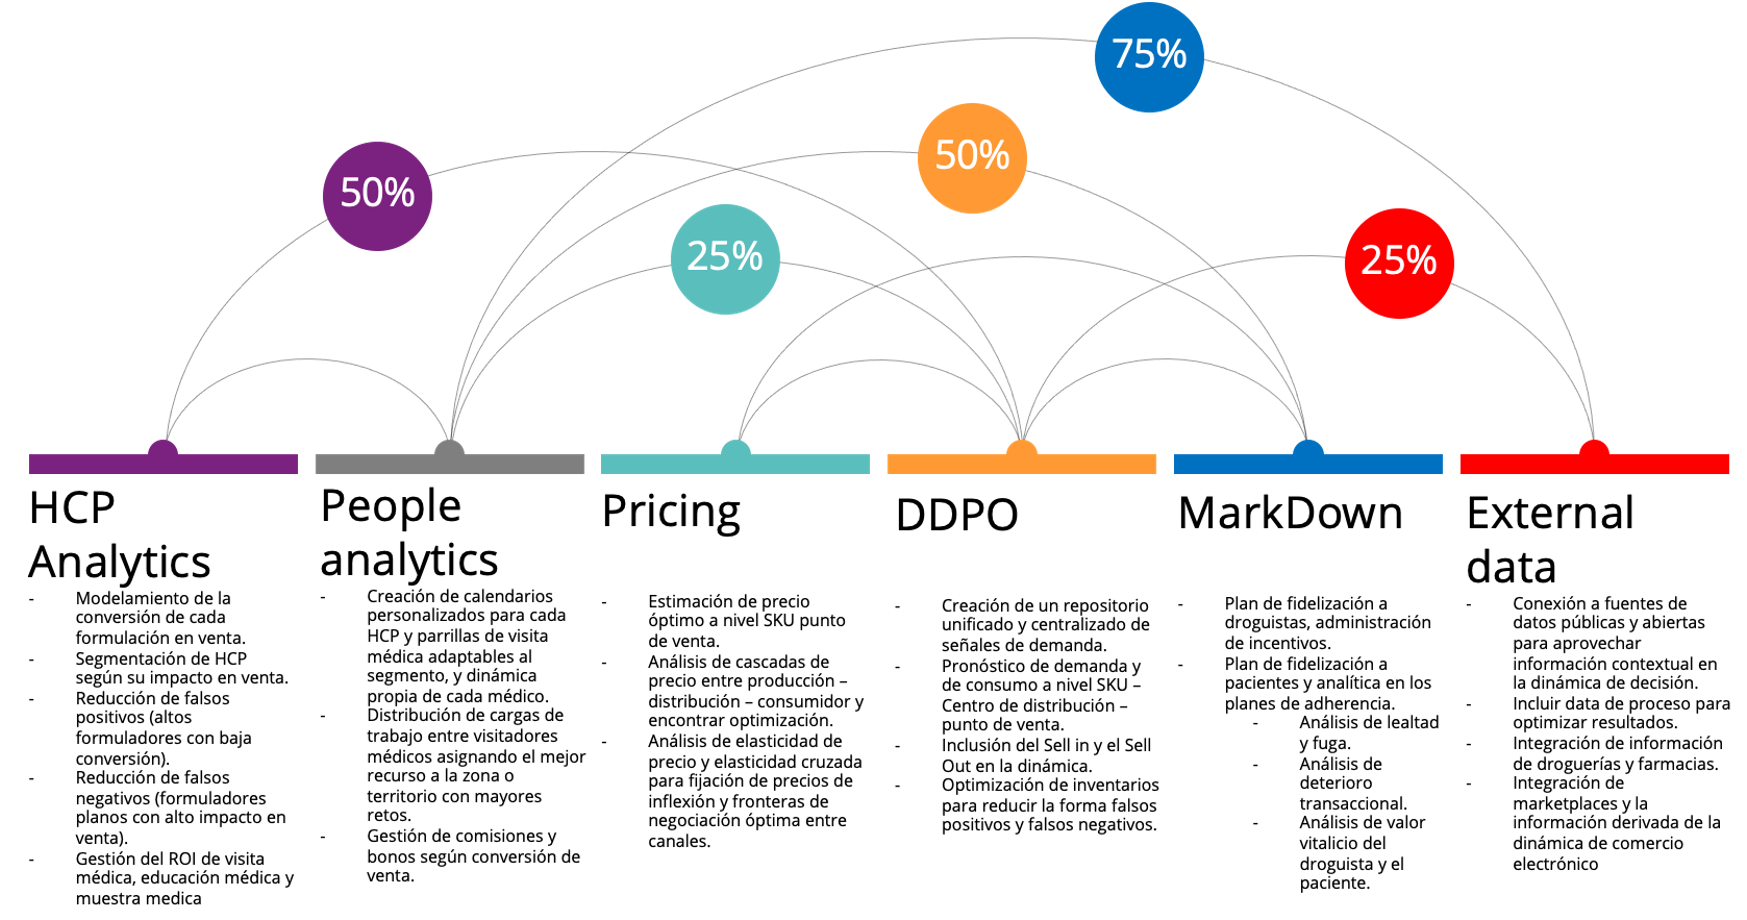
For this blog, we will be working on the first of six use cases. One of the most representative ones when it comes to converting prescription to sales: HCP Analytics (Health Care Professional Analytics)
PRESCRIBER ANALYTICS:
This use case has a 50% correlation with DDPO (Demand-Driven Planning & Optimizaton). This indicates that increasing prescriptions without improving demand planning at the POS (point of sale) results in a productive deadlock. The physician will prescribe, but the user will not necessarily find the product in the pharmacy.
| Business objectives |
|
| Data integration |
Using data input and data integration techniques, a data model is developed. As part of SINNETIC’s philosophy, we call it a Common Data Model. This integration is supported by ETL and ELT processes and the result allows the information to be used in different analytics and reporting settings, reducing search, integration and cleansing time. |
| Data analytics |
Bagging and Boosting Methods to integrate the models and estimate the ROI of each marketing activity on sales |
| Consumption and visualization |
Simulator to estimate the degree of investment required to achieve the prescription and sales target for each HCP |
It is evident that for the three layers of this use case, namely: 1. Data integration, 2. Data analytics and 3. Consumption and visualization, many technology architectures can be used for this process; here is an example using AZURE:
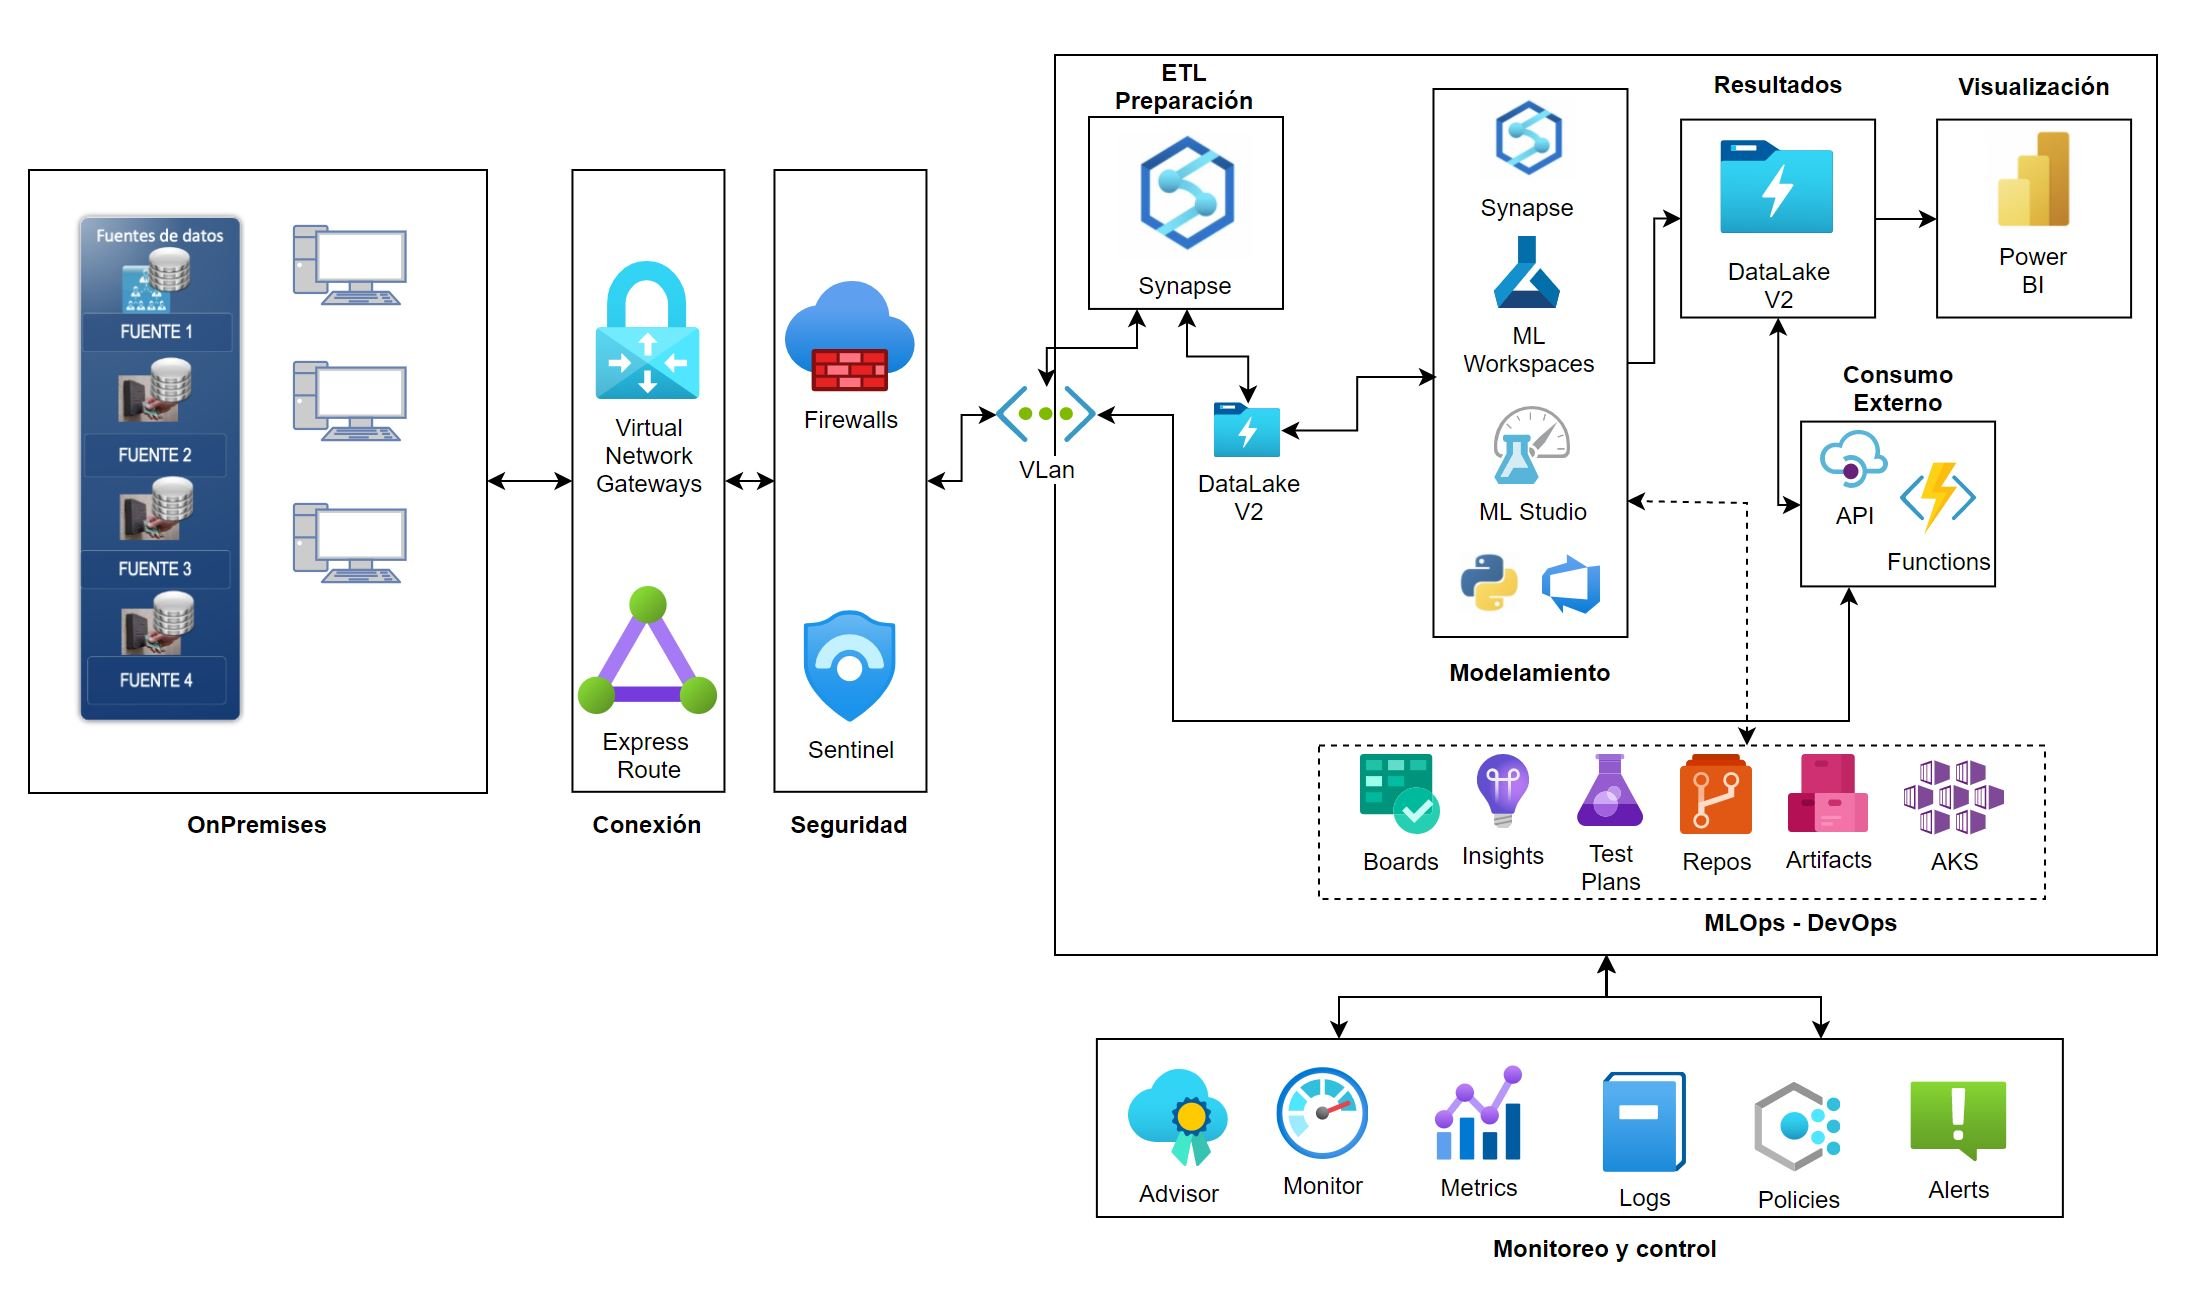
In this setting, we can see how data input is performed with Synapse to store it in the data lake. The analytical processes are carried out with Azure Machine Learning in ML Studio, and the information is consumed in Power Bi.
REFERENCE:
Gray, E. M., & Aronovich, R. (2016). Producing an ROI with a PCMH: patient-centered medical homes can deliver high-quality care and produce a healthy ROI for organizations that are willing to invest the time and effort required to plan for the transition and maintain the model. Healthcare Financial Management, 70(4), 74-80.
Jadczyk, T., Kiwic, O., Khandwalla, R. M., Grabowski, K., Rudawski, S., Magaczewski, P., ... & Henry, T. D. (2019). Feasibility of a voice-enabled automated platform for medical data collection: CardioCube. International journal of medical informatics, 129, 388-393.
Kolter, J. Z., & Ng, A. Y. (2009, June). Regularization and feature selection in least-squares temporal difference learning. In Proceedings of the 26th annual international conference on machine learning (pp. 521-528).
Wickramasingha, I., Elrewainy, A., Sobhy, M., & Sherif, S. S. (2020). Tensor Least Angle Regression for Sparse Representations of Multidimensional Signals. Neural Computation, 32(9), 1697-1732.
At SINNETIC, our cognitive services unit develops analytical and artificial intelligence models to...
According to our Consumer Pulse observatory, 63% of interviewees report a reduction in their...
During the 1990s and the first decade of the 20th century, the concept of customer satisfaction was...