During the 1990s and the first decade of the 20th century, the concept of customer satisfaction was the main concern of service and marketing executives. But in the second decade of the 20th century the concept of customer experience begins to gain momentum; what's the difference?

| |
Customer satisfaction |
Customer experience |
| Who is the main character? |
The process is behind the consumer's sense of satisfaction |
The user is responsible for their own experience |
| What is the role of the process? |
To generate in the user scenarios and sensations of wellbeing |
Show the user how to achieve a better experience |
| What is the role of measurement? |
Track errors and failures to ensure user satisfaction with the current product/service |
Find new unmet user needs |
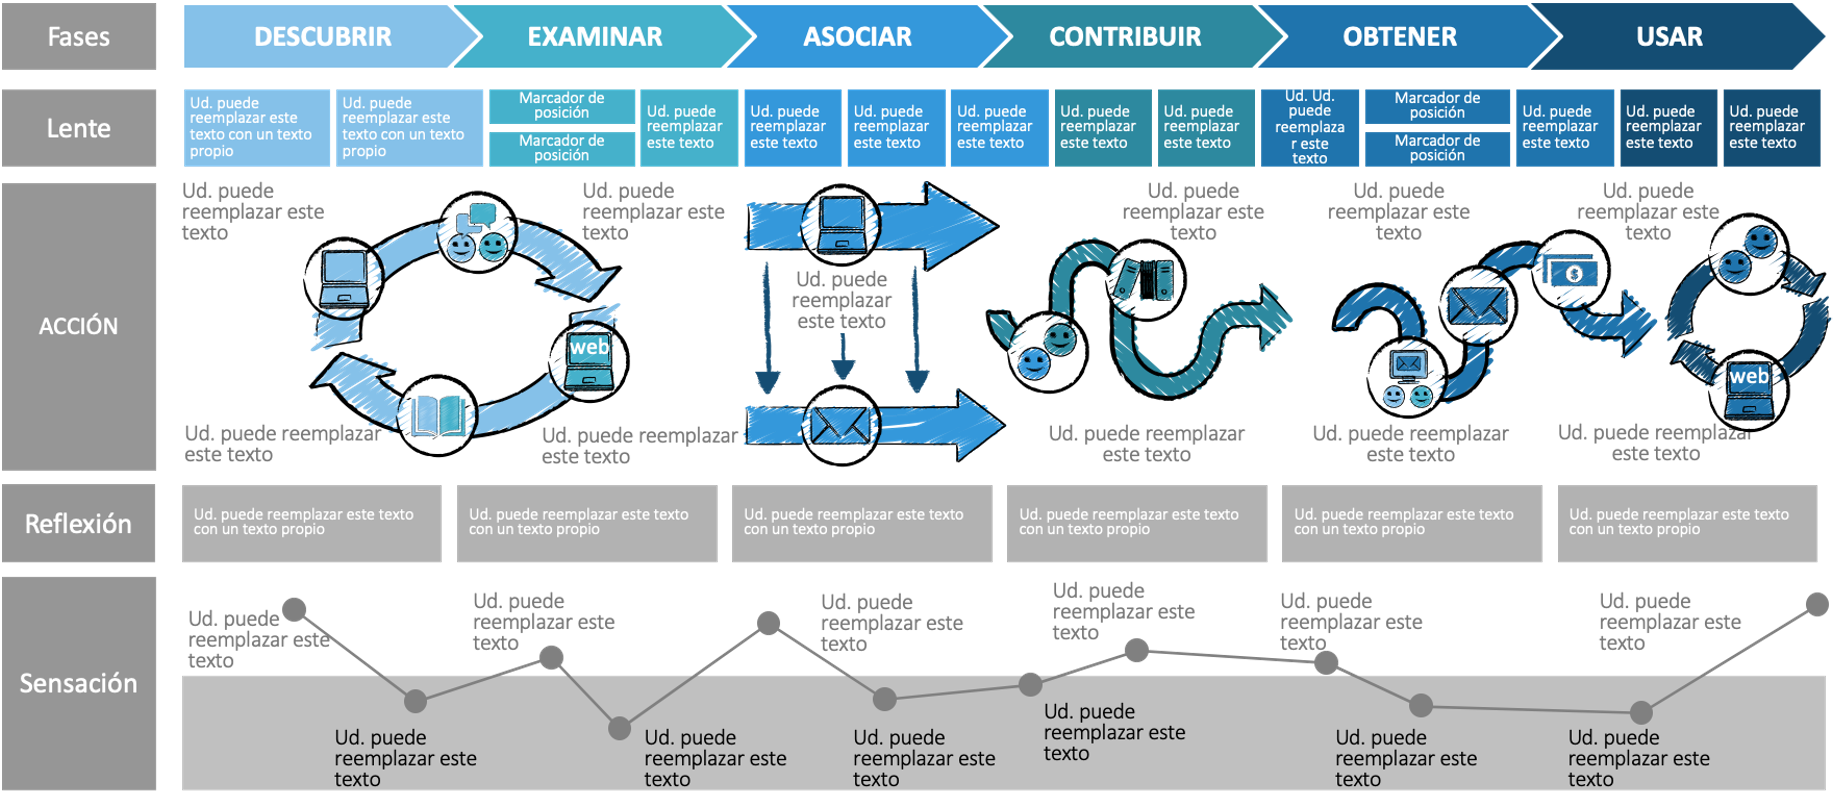
One of the most important tools when managing customer experiences is the "Customer Journey Map" (CJM), which is a specific tracking system that follows the user's interaction with each touchpoint.
Until now, qualitative methods have been used with high efficiency to describe theoretical "Customer Journey Maps", which describe the ideal user experience. But by integrating data from the organization's different transactional systems, it is possible to describe an empirical "Customer Journey Map".
The following are some differences between the theoretical vs. empirical CJM:
| |
Theoretical CJM |
Empirical CJM |
| What are the theoretical bases for this approach? |
- Total quality philosophy
- Swedish Customer Satisfaction Barometer (SCSB)
- American Customer Satisfaction Index (ACSI)
- Norwegian Customer Satisfaction Barometer (NCSB)
- European Customer Satisfaction Index (ECSI)
- Hong Kong Customer Satisfaction Index (HKCSI)
|
- Behavioral economics
- Consumer Bias
- Decision heuristics
- Nudge
- Consumer opinions/ reviews
|
| What information is used to build it? |
- Historic satisfaction surveys
- Qualitative user experience studies
- Matching points in user experience brainstorming sessions
|
- Input and integration of data coming from the organization's different transactional systems and contact tools
|
| What does it describe? |
- The ideal experience, what should be appropriate for the user's experience
|
- What the user has actually experienced, sequentially at each touchpoint
|
| What benefits does it provide? |
- Guidance to improve processes and align their digital and cultural transformation
|
- Taking advantage of the digital fingerprint of the authentic user experience
|
| How do they contribute to building up the experience? |
- Adaptation of the process to the challenges of the competitor and the market
|
Find the bottlenecks and process issues that prevent the user from being able to self-manage
|
| Weaknesses |
- Focuses on service hypotheses and proposes management models based primarily on the competitor and the market
|
- Focuses on internal data and how to take advantage of it, regardless of the competitor or industry benchmark
|
HOW TO DEVELOP AN EMPIRICAL JOURNEY?
Podemos hablar de 4 grandes etapas:
We can refer to 4 main stages:
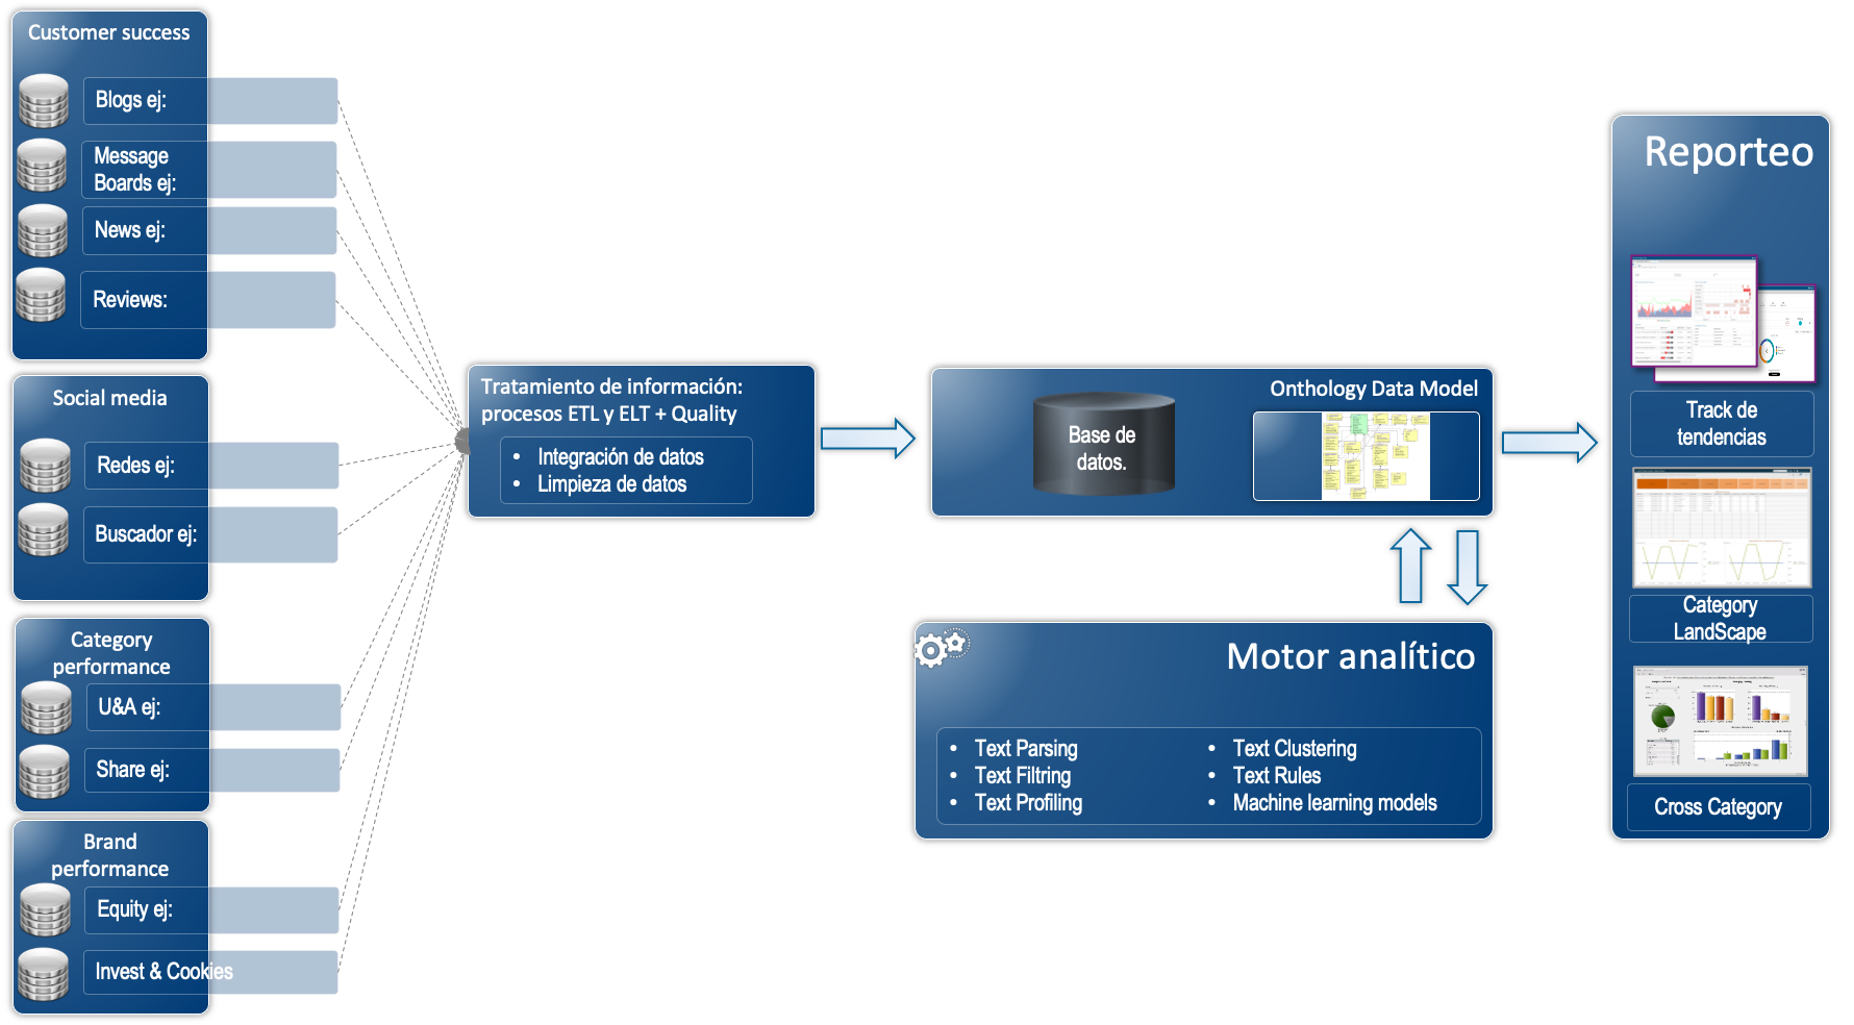
Data input: At this stage, we are interested in mapping all transactional systems that account for the customer experience. Example: in the billing system, service, contact center, PQRS, etc.; there is a trail of the user's transaction with date and time
Data integration: Here, we are interested in generating an ABT (Analytics Based Table) that integrates information from the earliest to the latest event. This allows you to see the user's actual journey

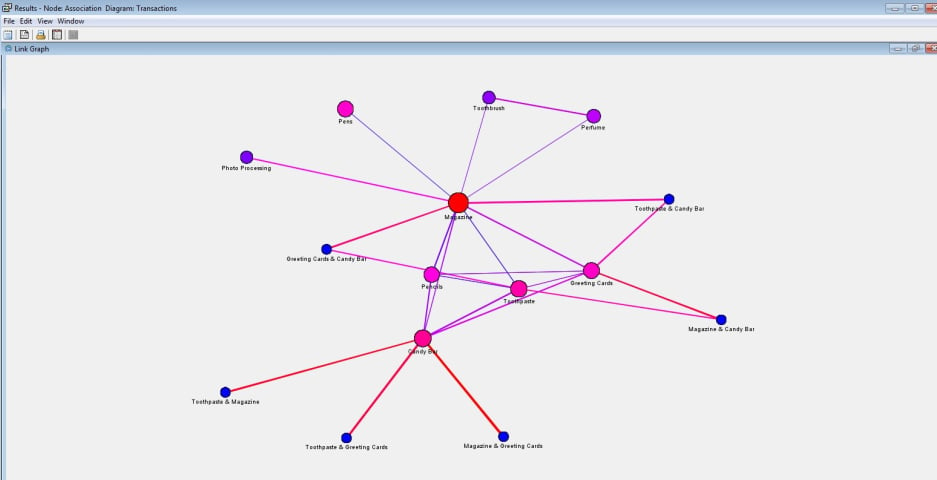
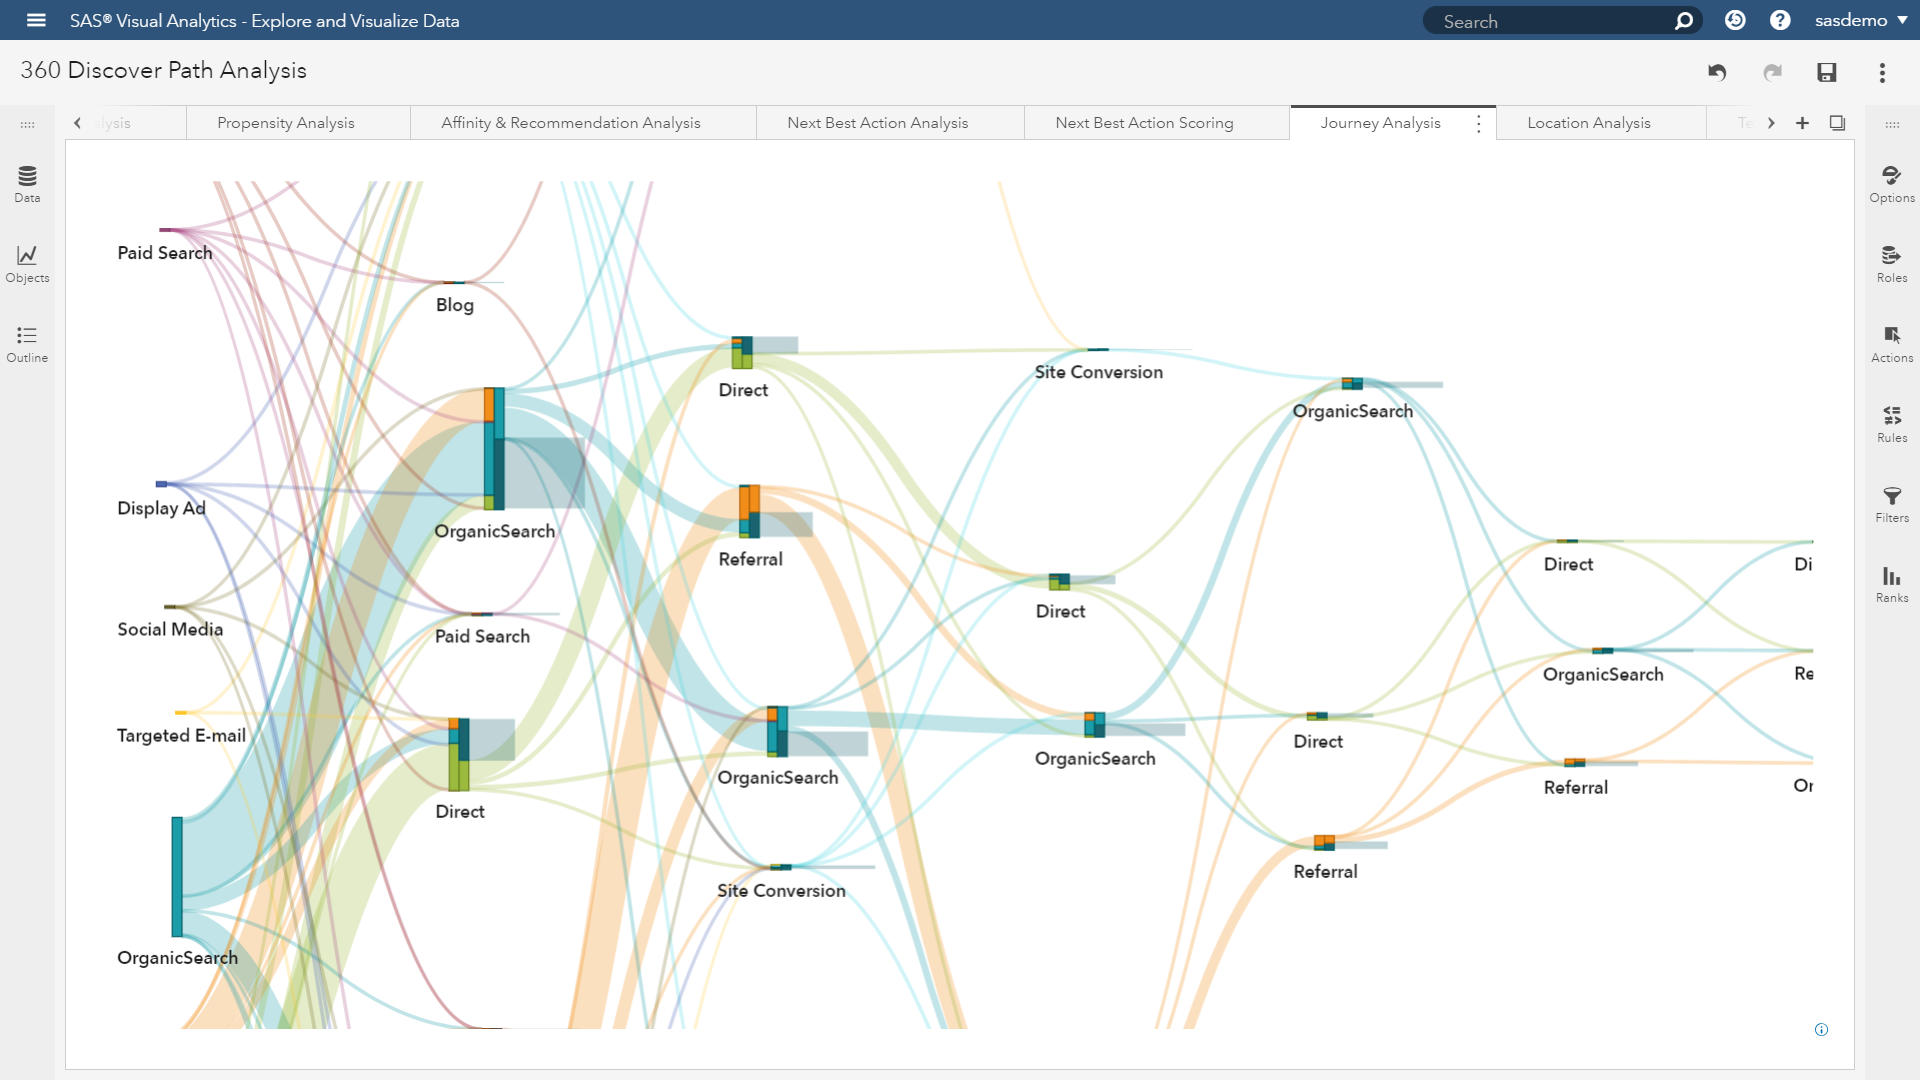
Data analytics: By means of association rules (data mining algorithm) frequent, repetitive sequences can be found by comparing the journeys of all consumers and grouping those whose sequences are similar. This makes it possible to segment audiences and act efficiently Visualization and consumption of information: Set up Sankey graphs to plot frequent experiences. This allows sizing funnels and bottlenecks. An example of visualization in SAS is shown below:
