Data science in pharma: Connecting prescriptions to sales
The pharmaceutical sector has commercial and "go to market" challenges to overcome. Some use cases...


During the 1990s and the first decade of the 20th century, the concept of customer satisfaction was the main concern of service and marketing executives. But in the second decade of the 20th century the concept of customer experience begins to gain momentum; what's the difference?
| Customer satisfaction | Customer experience | |
| Who is the main character? | The process is behind the consumer's sense of satisfaction | The user is responsible for their own experience |
| What is the role of the process? | To generate in the user scenarios and sensations of wellbeing | Show the user how to achieve a better experience |
| What is the role of measurement? | Track errors and failures to ensure user satisfaction with the current product/service | Find new unmet user needs |
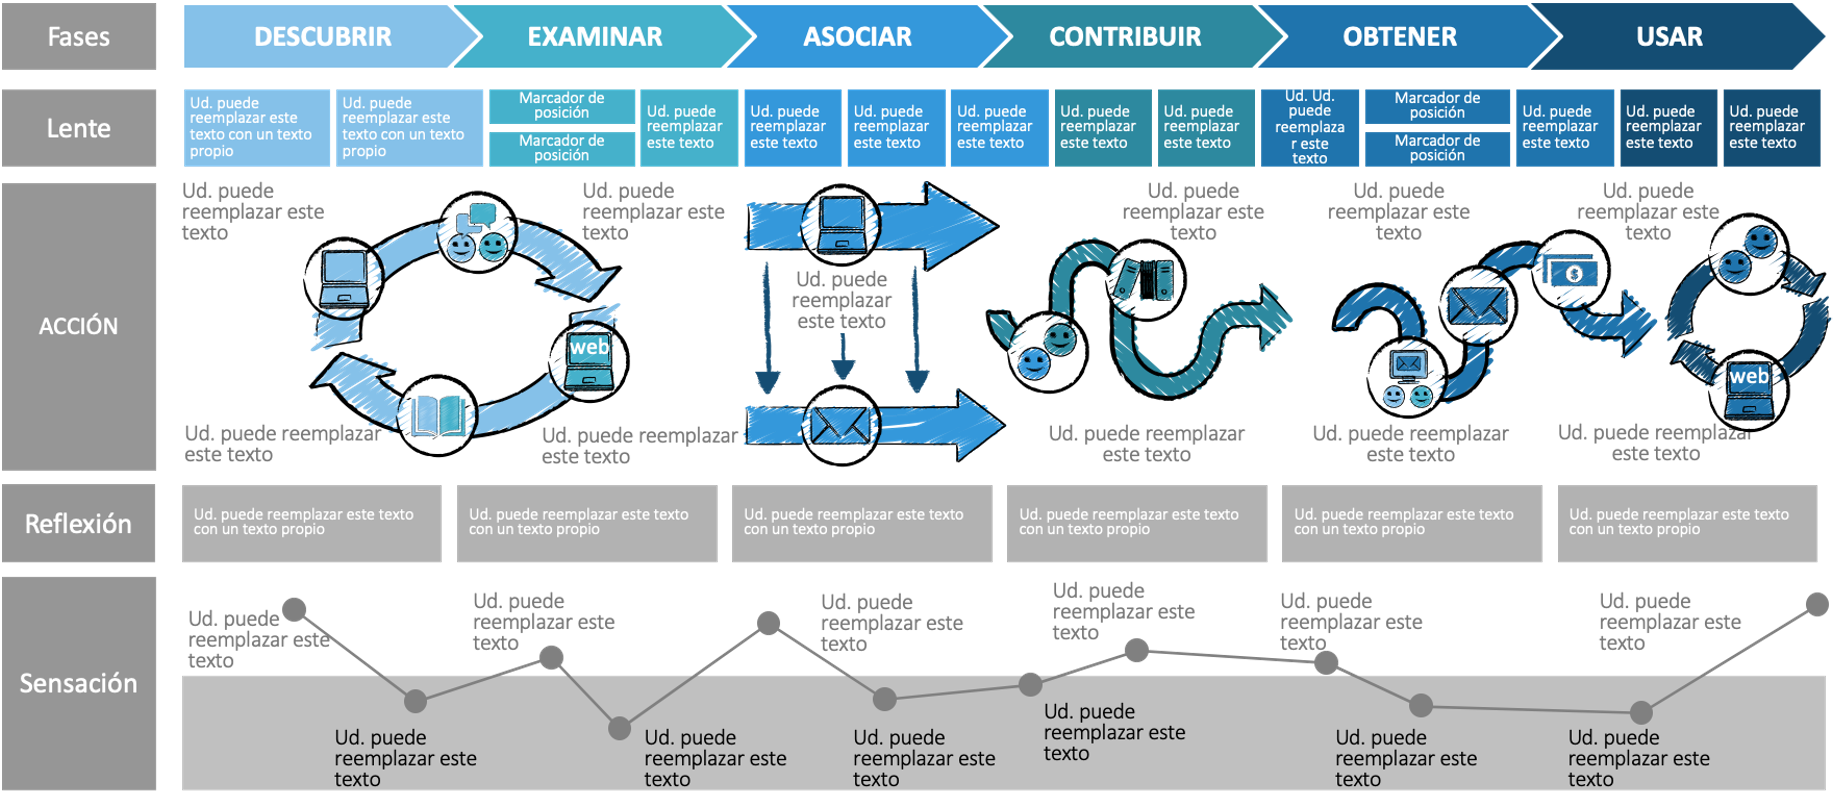
One of the most important tools when managing customer experiences is the "Customer Journey Map" (CJM), which is a specific tracking system that follows the user's interaction with each touchpoint.
Until now, qualitative methods have been used with high efficiency to describe theoretical "Customer Journey Maps", which describe the ideal user experience. But by integrating data from the organization's different transactional systems, it is possible to describe an empirical "Customer Journey Map".
The following are some differences between the theoretical vs. empirical CJM:
| Theoretical CJM | Empirical CJM | |
| What are the theoretical bases for this approach? |
|
|
| What information is used to build it? |
|
|
| What does it describe? |
|
|
| What benefits does it provide? |
|
|
| How do they contribute to building up the experience? |
|
Find the bottlenecks and process issues that prevent the user from being able to self-manage |
| Weaknesses |
|
|
HOW TO DEVELOP AN EMPIRICAL JOURNEY?
Podemos hablar de 4 grandes etapas:
We can refer to 4 main stages:
Data input: At this stage, we are interested in mapping all transactional systems that account for the customer experience. Example: in the billing system, service, contact center, PQRS, etc.; there is a trail of the user's transaction with date and time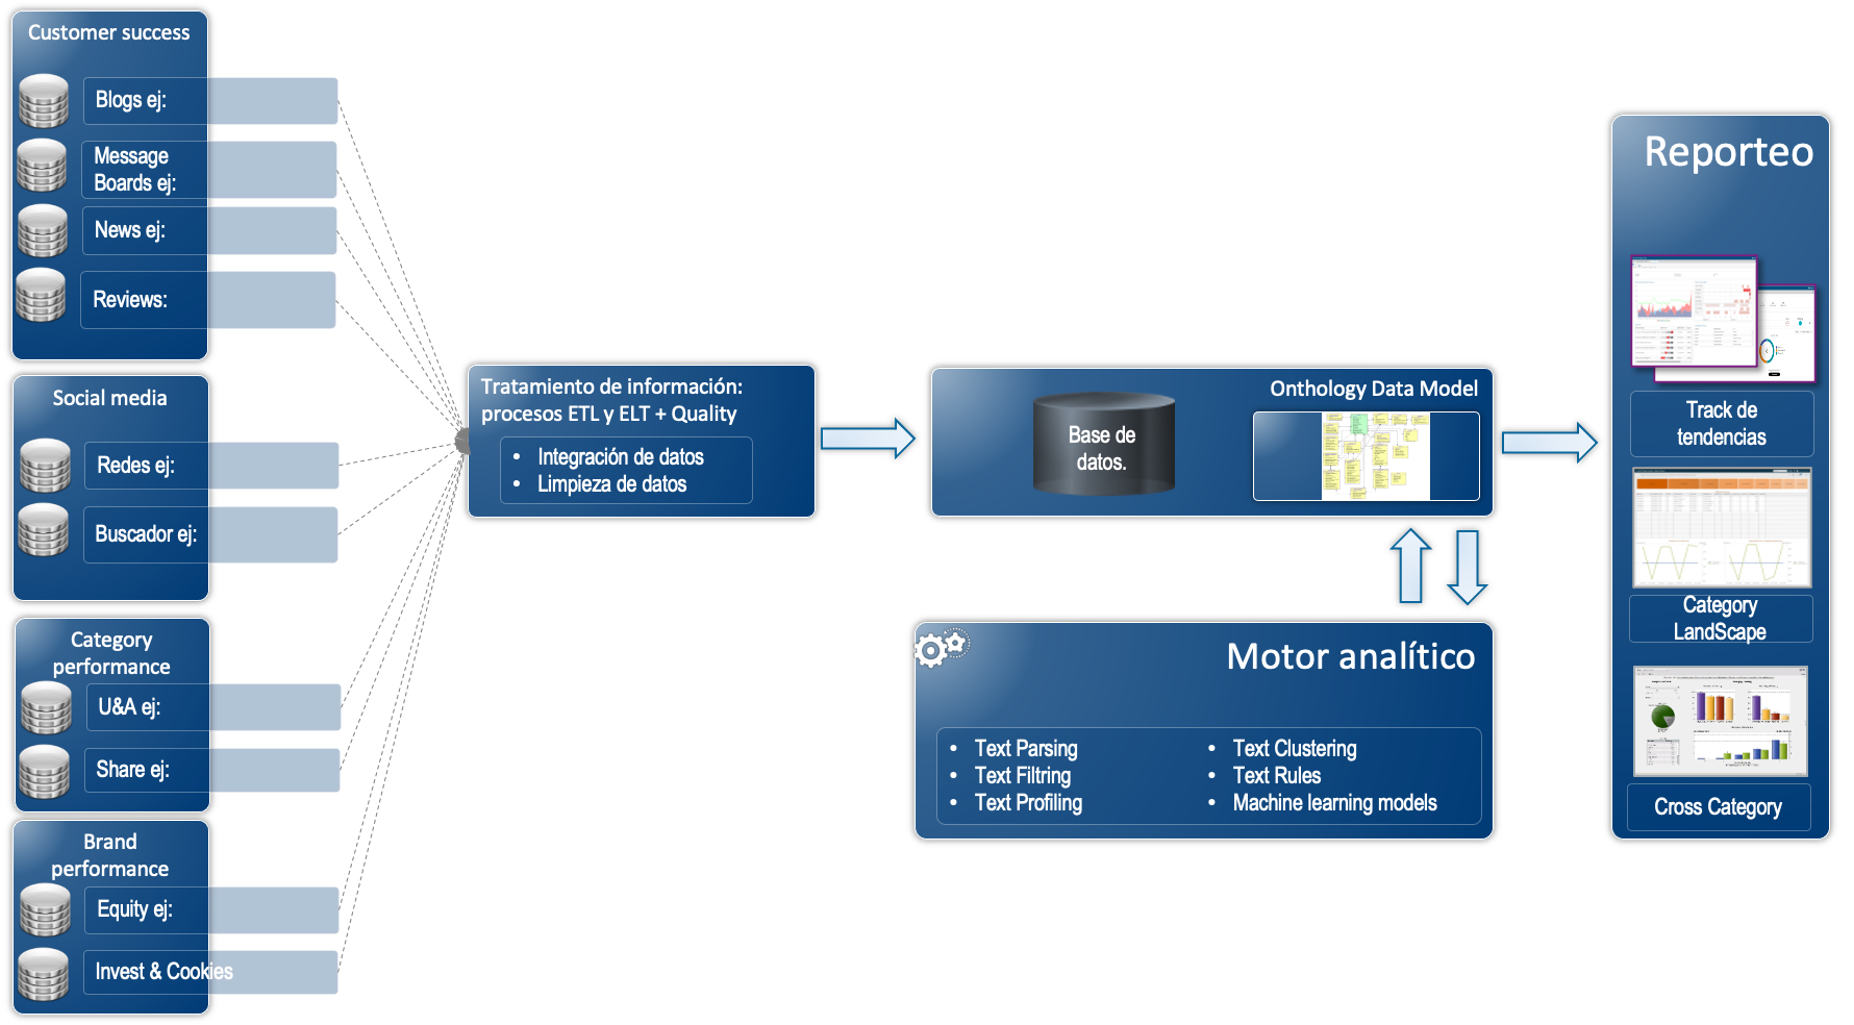
The pharmaceutical sector has commercial and "go to market" challenges to overcome. Some use cases...
At SINNETIC, our cognitive services unit develops analytical and artificial intelligence models to...
According to our Consumer Pulse observatory, 63% of interviewees report a reduction in their...